
Choose the level of the question
A BASIC line, a C statement and a processor instruction are different units of work. A single high-level statement can execute many machine instructions. The best starting view depends on the question: a BASIC score that becomes negative, a C function that returns the wrong value or a store that writes the wrong memory address.
Use the language workspace when you want the source you wrote, its breakpoints and its variables. Use Debug → Show Debugger to inspect the shared machine independently of whether a source document is available. The machine debugger can pause a running program and step one CPU instruction at a time.
You can move between these levels. A named variable suggests which memory to inspect; disassembly shows how a compiled operation was carried out. The point is to connect the observations rather than mistake one view for the complete story.
A breakpoint is a question about a moment
Pick a stop just before the action you suspect. If a score is wrong after subtraction, inspect it before subtraction and then after one step. If a program cannot open a data file, stop around the call and check the actual result. A stop far downstream may show the consequence without revealing the cause.
At a BASIC stop, use statement stepping, Variables and Watches. In C, the Call Stack connects active function calls to their available values. Select a caller to inspect its frame, then use Show Current Frame to return to the active stop. Continuing still resumes the current execution state, not the caller you happened to inspect.
In assembly, a source stop is associated with an executable instruction. A declaration or label is not necessarily an instruction that can execute. The native build workflow can verify stops against the matching artifact; a stale listing from an earlier build should not be used as proof of where the new source runs.
Follow the CPU in Inspector
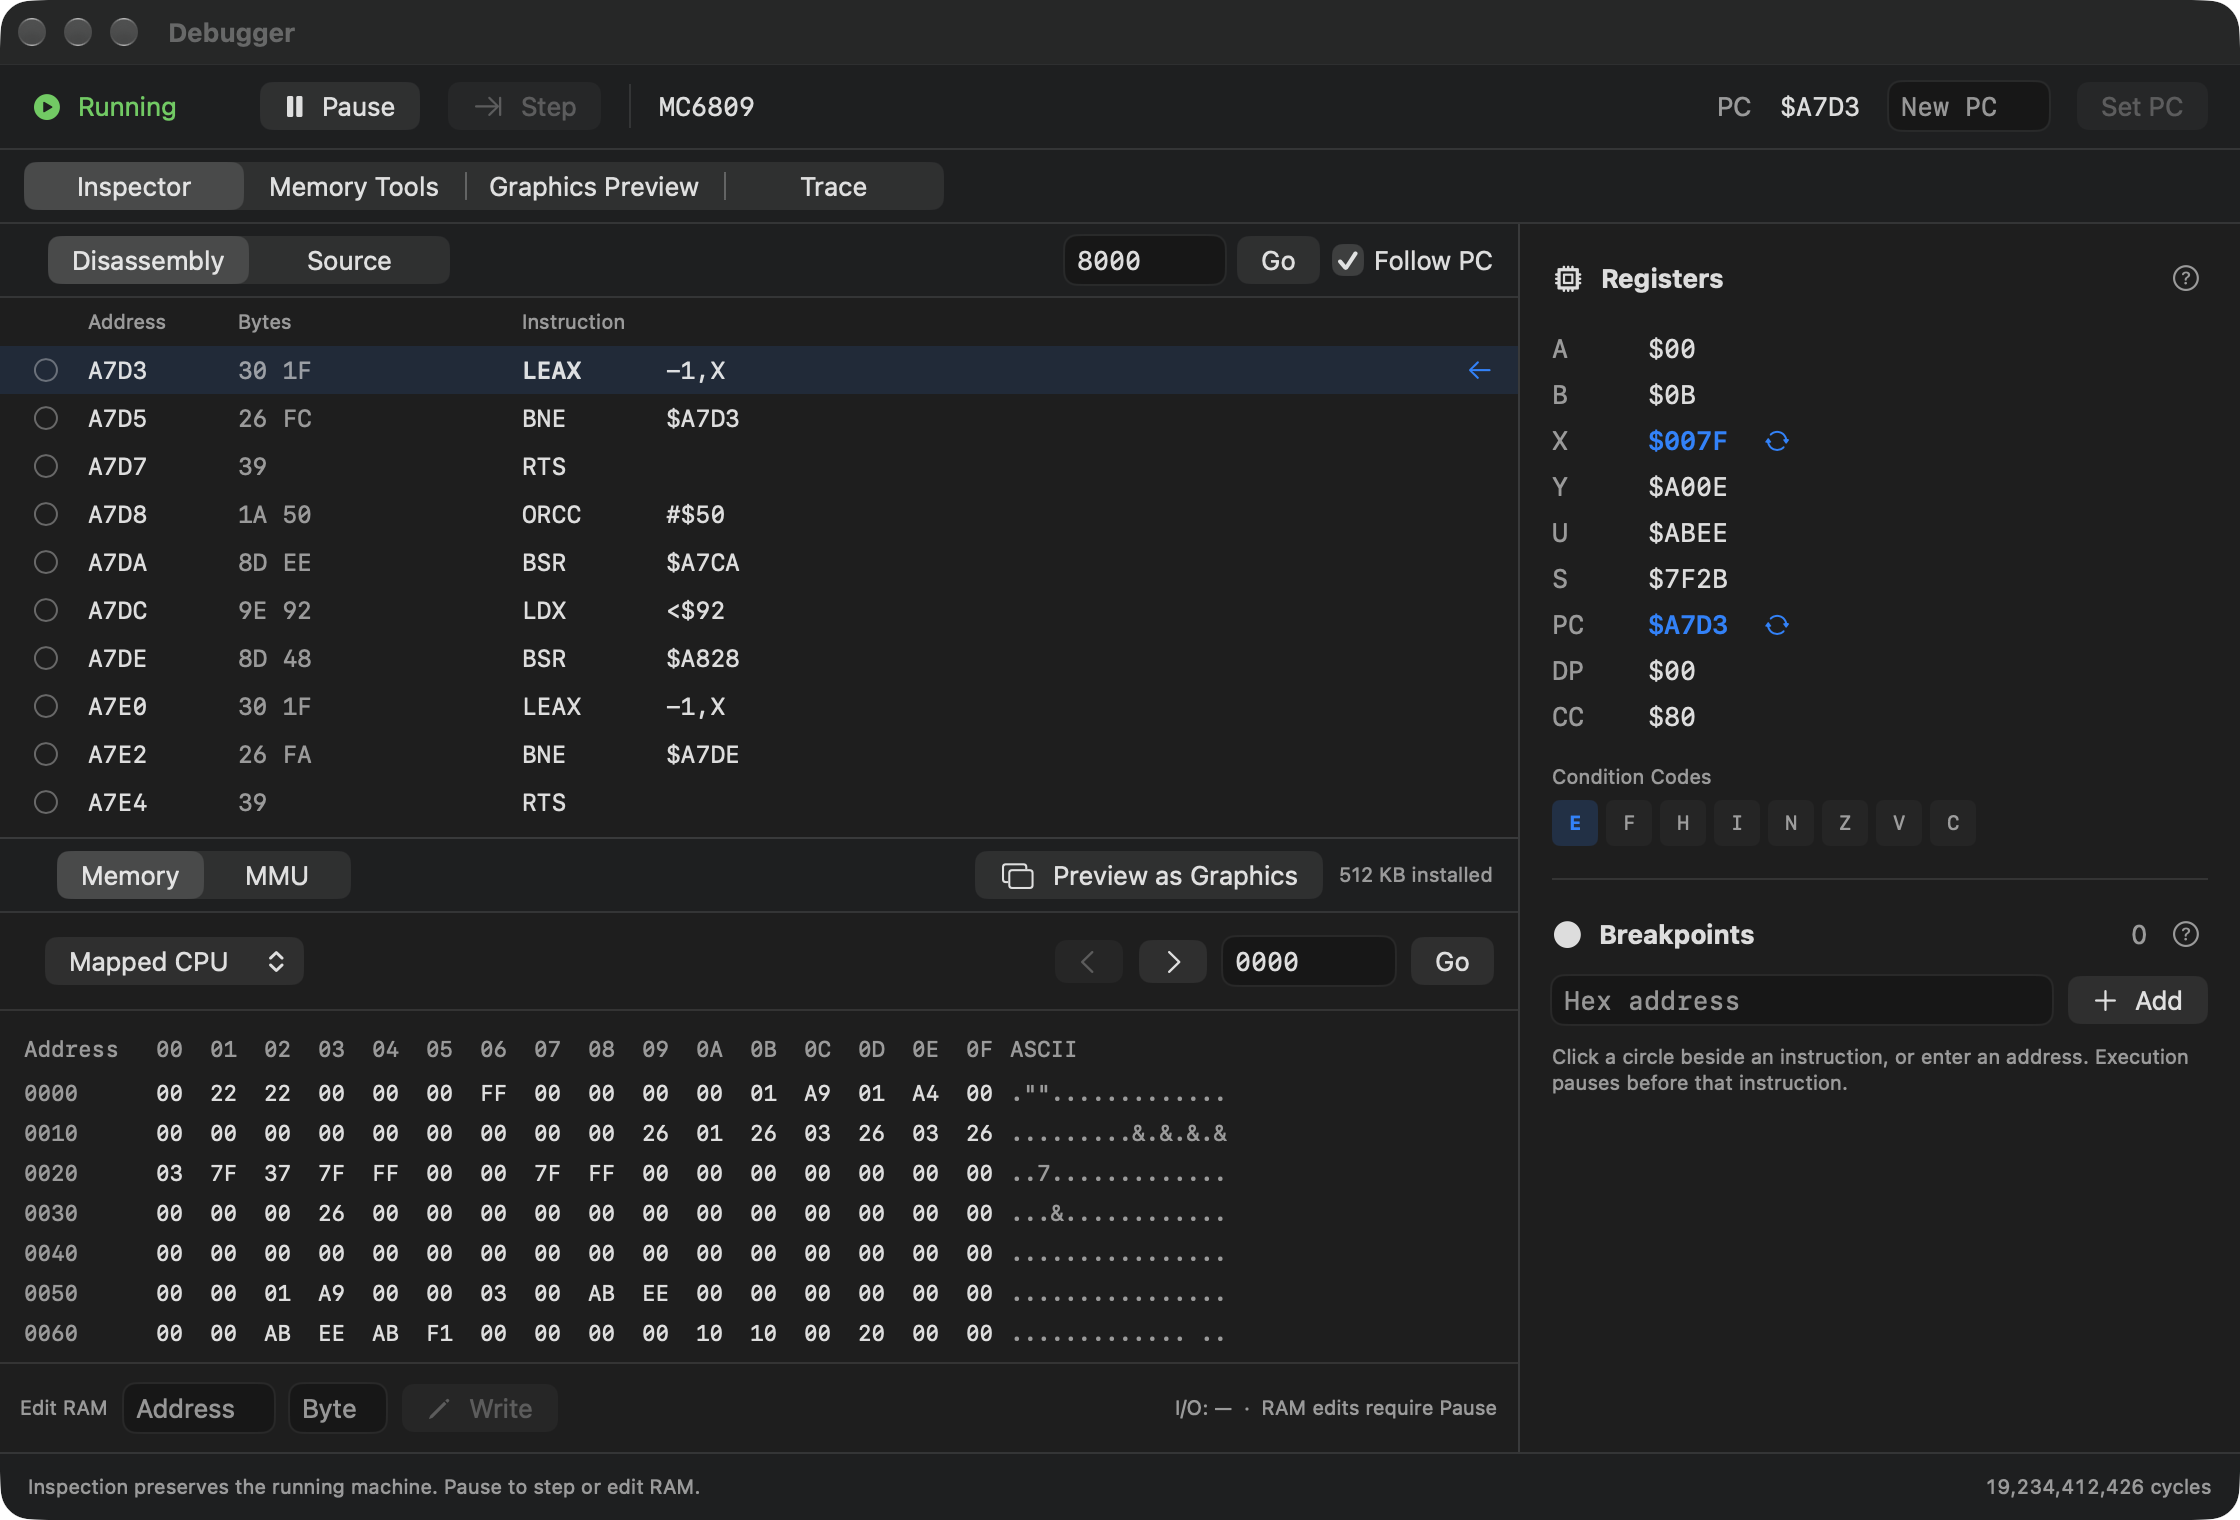
The machine debugger’s Inspector brings the program counter, disassembly and registers together. The PC tells you where the CPU will execute. A disassembly view interprets bytes as instructions; a Source view can use an assembler listing when available. Address breakpoints let you stop even when you do not have high-level source.
Go, Follow PC and Show in Memory change your inspection target. Setting the PC changes execution when the machine resumes. Writing a memory byte changes the machine. Those are useful experimental controls, but they answer a different question from passive observation: you are intervening in the program rather than just reading its state.
An address breakpoint can be disabled while keeping its location. That is convenient when comparing two runs: pass through a stop temporarily without rebuilding a list of addresses later. Keep the program and its loaded configuration consistent when making that comparison.
Logical addresses and physical RAM
A CPU address is what the running instruction uses. Physical RAM is the underlying storage. The CoCo 3’s memory management can map blocks of that RAM into the CPU address space, so the same logical address is not always a permanent name for one physical byte.
The MMU view shows the programmed banks and two task columns. Its RAM backing controls let you follow a mapping to the physical memory behind it. Effective read identifies what currently supplies a CPU read; a ROM overlay can hide the RAM beneath the same logical address.
That distinction is particularly useful with operating systems, banked data and programs that change mappings. If the byte you inspected is not the byte a routine reads, look at the address space and mapping before assuming the memory inspector is wrong. A physical RAM export and a CPU-visible export may intentionally differ.
A session’s address breakpoint refers to a logical CPU address. When diagnosing a bank-switching problem, record the relevant mapping along with the address. An isolated hexadecimal number is often too little context to reproduce the observation.
Memory Tools: inspect and keep a range
Memory Tools works on a selected address space and range. Use it to disassemble bytes or export them for comparison. Start and End are hexadecimal; the ending byte is included. The assumed CPU origin for a physical-RAM disassembly influences how relative branch targets are presented.
The disassembly preview is bounded to 128 rows. Export Binary… writes the whole selected range as raw bytes. A raw memory dump is not automatically a Disk BASIC loadable file: that format also needs load and execution information. Use the assembly workspace’s export when you want a program packaged for that guest loading workflow.
OS-9 interpretation can identify system calls and module headers while examining OS-9 code. Interpretations depend on the bytes and context you selected; keep that context with the exported result. Comparing a before-and-after range can be enough to answer a very small question, such as whether a routine changed the intended table.
Graphics Preview: connect pixels to bytes
A display is an interpretation of memory through video settings. Graphics Preview starts from the current video page and also lets you select an address space, address and graphics mode. Use it to ask what a particular buffer would look like as pixels rather than relying only on a finished screen.
Select a point in the image or enter X and Y in Pixel Inspector. Show Byte in Memory takes you to the byte behind that point. Zoom changes the preview, not the program. Highlight step changes helps identify a changed pixel after executing another instruction.
This is useful for an off-screen graphics page or a drawing routine that has not yet published its result. A preview of the paused registers and memory is different from the last completed framebuffer. Neither alone proves animation timing. Compare the view appropriate to the question you are investigating.
For ordinary appearance, the app also offers RGB and composite signal choices, alternate composite colors, fit or integer scaling and scanlines. Those controls can explain why familiar artwork looks different without any change to the program’s stored data. The hardware tour explains the monitor’s role.
Trace: look back at instructions
Stepping is ideal when you already know where to stop. Trace helps with a bounded question about what happened before a point. Set a maximum sample count and optional start and stop addresses, then Start New and reproduce the event.
Stop recording before reviewing samples. Select a sample to compare before-and-after registers. Markers and optional screen or scheduler events add context when comparing two moments. Go reaches a sample number; Mark A and Mark B identify points you want to compare.
Starting and stopping recording do not by themselves change whether the CPU is running. Start New replaces an earlier capture, so export anything valuable first. Export CSV… preserves a selected sample range for later inspection. Bounded capture keeps the record focused enough to explain instead of producing an unmanageable history of everything.
A result needs its configuration
Keep the source revision, build mode, processor, memory, loaded media and relevant input sequence with a useful test result. A successful MC6809 run does not establish that a 6309-only path behaved the same way. A correct framebuffer does not establish that a save file was written or that a sound reached a speaker.
The same discipline applies to AI-assisted tests. Ask the assistant to state what it actually observed and which capability was unavailable. A compiler success, a reached breakpoint, a captured picture and an audible result each establish a different part of the program’s behavior. The workbench makes those parts inspectable so your next correction can be small and purposeful.