
Chapter 7 of 7
Hand someone a reproducible bug
“Sometimes the picture is wrong” gives the next investigator a lot of work. “My program reached line 80, and the byte for the new dot changed on the other page” gives them an experiment. Make a small evidence packet that a second reader could reproduce from a fresh machine.
Reproduce the observation
Start a fresh Disk BASIC, 512 KB, RGB session. Record which guest CPU you selected. Open BEACON.bas in BASIC Development, set breaks at 70 and 80, and Run. The monitor shows the house. The stop at 70 is before PSET. Use Continue once to reach 80, where the draw has happened. Save both observations, including the unchanged monitor and the hidden page viewed at mapped $1A00.
To capture the bytes around the beacon, take these steps at each stop:
- Open Debug → Show Debugger → Memory Tools. Select Mapped CPU. Enter start 1E10 and end 1E1F. Both endpoints count, so the file will contain sixteen bytes.
- Choose Export Binary… and give each stop a distinct name, for example beacon-before.raw and beacon-after.raw. Pause at the stated line while saving. An export captures memory when requested. An older disassembly left on screen can describe an earlier instant.
- At line 80, repeat the export with Physical RAM, start 71E10, end 71E1F. In this setup it agrees byte for byte with the mapped after-file. If another setup maps block zero differently, compute the address from its MMU table first.
| Stop | Sixteen captured bytes, first to last |
|---|---|
| 70, before PSET | FF FF BF FF FF FF FF BF FF FF FF FF FF FF FF FF |
| 80, after PSET | FF FF BF FF EF FF FF BF FF FF FF FF FF FF FF FF |
Count the first byte as offset zero. Offset 4 means $1E10 + 4 = $1E14, the same answer the pixel calculation gave. The surrounding BF bytes belong to the receiver drawing and appear in both files. Record the result in your report: one changed byte, one changed hidden pixel, same displayed house. Clear the breakpoints and Continue. Three separate Space taps reveal the receiver, bring back the house and return to BASIC. At OK, enter PRINT 2.
Give physical code a CPU address
Repeat the assembly warm-up with pixel-mask.asm, stopping on shift. How could another reader tell which instructions lay next to this stop? The debugger can show the actual bytes in the backing RAM alongside the addresses the CPU used.
Choose Memory Tools → Physical RAM. In the practice configuration enter 73F00 through 73F09, and give Assumed CPU origin the value 3F00 from the listing. Leave OS-9 interpretation off and choose Disassemble. Read the first row across. The physical address $073F00 holds bytes 30 8D 00 06. The CPU saw those bytes at $3F00 as LEAX 6,PCR. Its PC after fetching the four-byte instruction is $3F04, so the effective address is $3F04 + 6 = $3F0A. The five decoded instructions end with RTS at CPU $3F09.
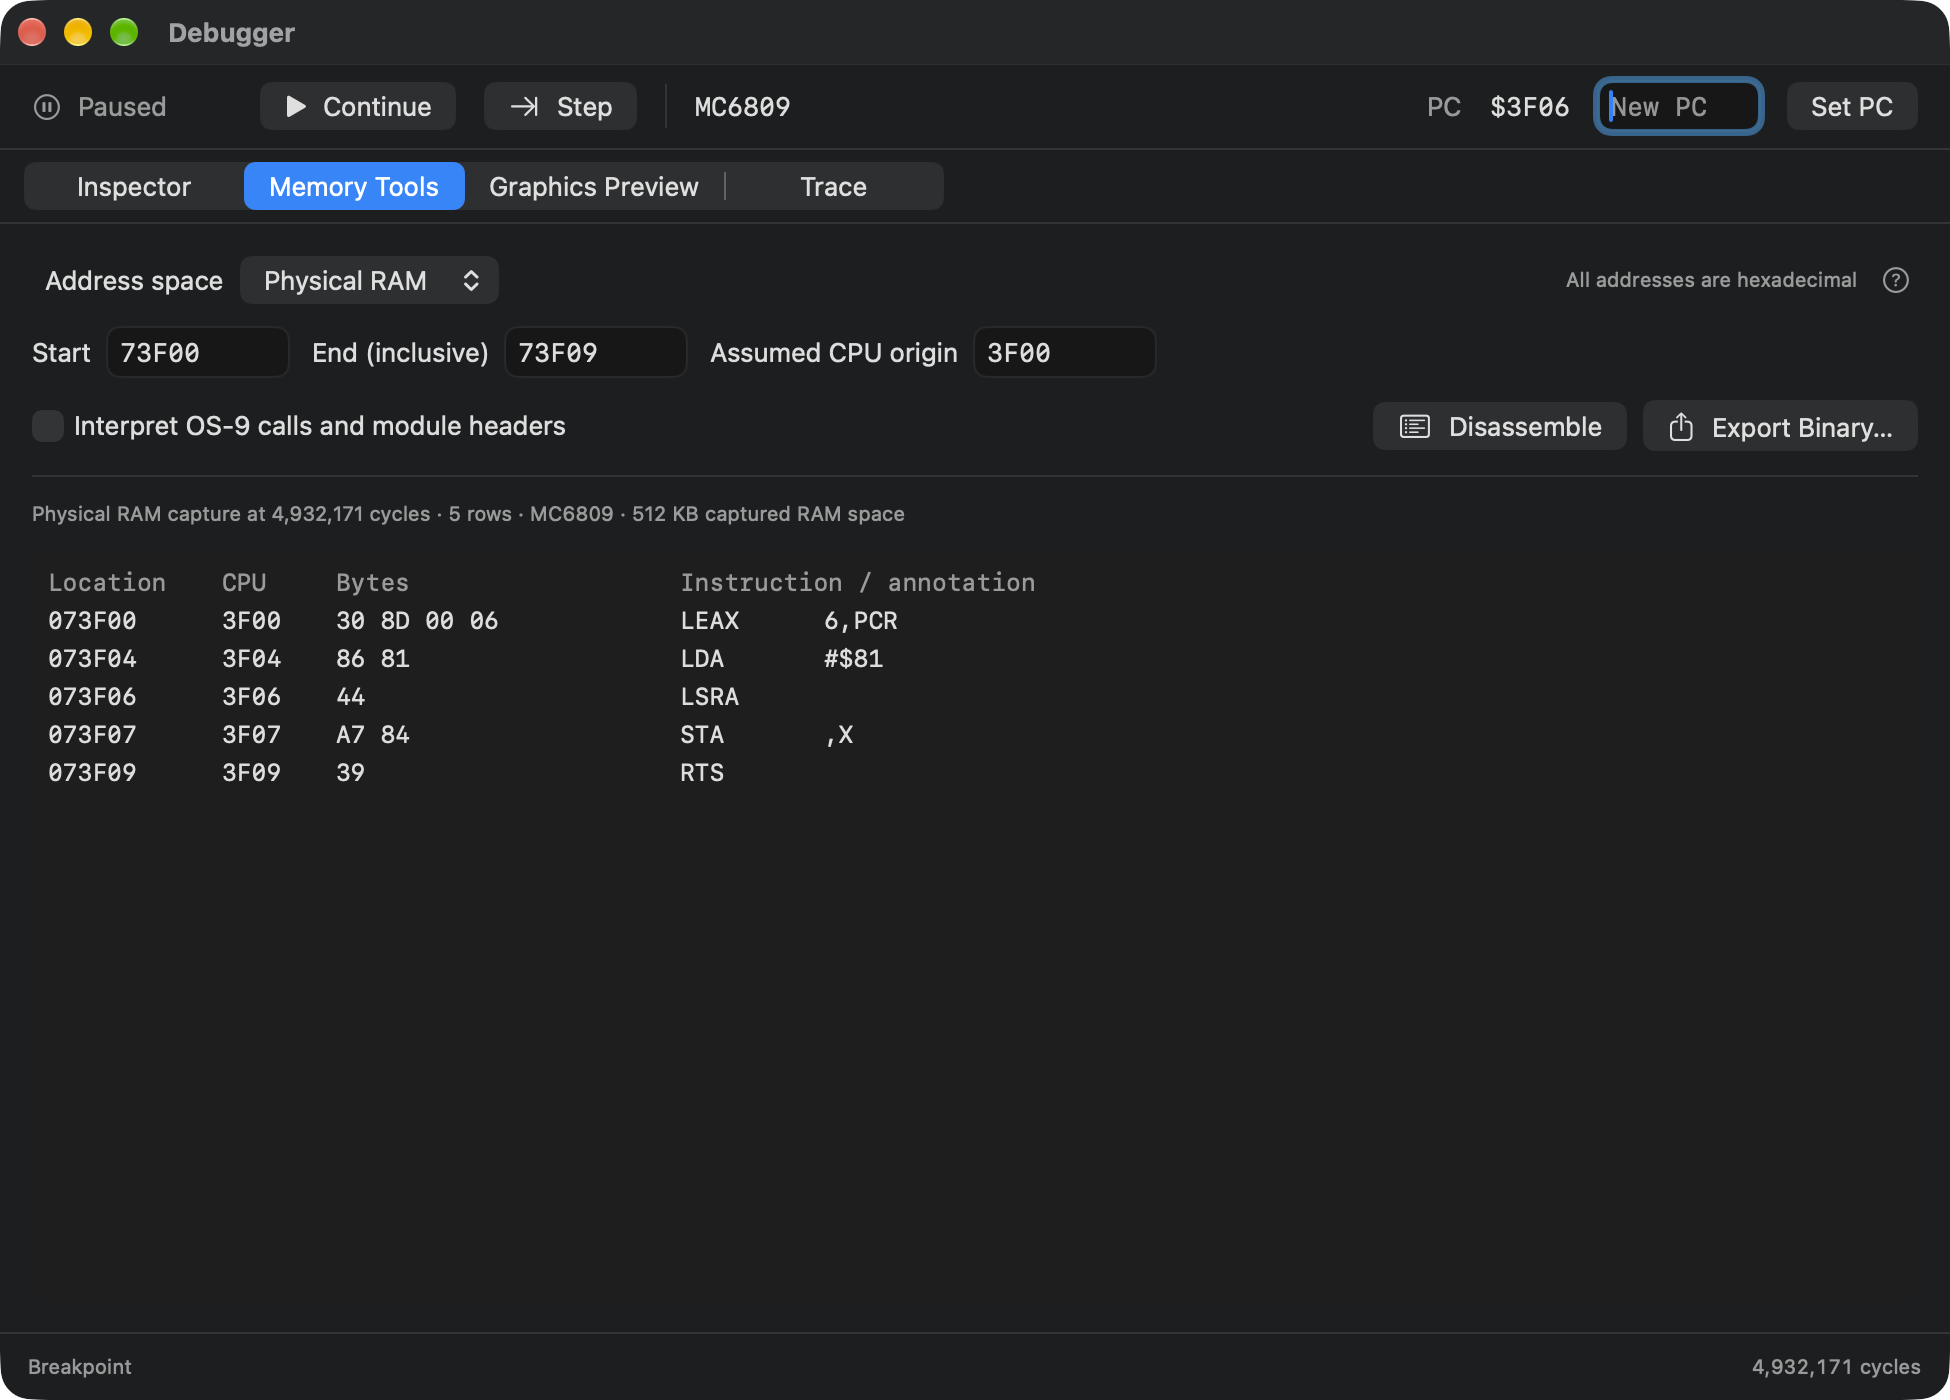
The origin supplies the CPU coordinates for this interpretation, including relative branch targets. Changing it does not relocate the program or alter the file. For a direct check, choose Export Binary…. The ten bytes saved by the native app were 30 8D 00 06 86 81 44 A7 84 39. The next byte, the data at $3F0A, falls outside your range. A raw capture carries no start address or Disk BASIC LOADM record. Include the address space and range in your notes. To give someone a runnable program, use the Assembly workspace’s binary export instead.
Give the trace a readable key
At the shift breakpoint, open Trace. Use the earlier settings: 64 samples, start at 3F06, stop before 3F09. Choose Start New, then Continue. Save any trace you want to keep before starting another one. When the status reports the stop address, choose the inclusive first and last sample numbers under Export samples and click Export CSV…. Leaving the last field blank selects through the current last sample. For the illustrated run, 1 through the last sample preserved the interruption and the return.
A spreadsheet’s pc column gives 16134 for the shift because address and register numbers in the CSV are decimal. The native window formats the same PC as hexadecimal $3F06. bytes is a hexadecimal instruction-byte string. Here are the two executed instruction rows to find in your own export:
| instruction | pc → next_pc (decimal) | before_A → A (decimal) | bytes | cpu_cycles |
|---|---|---|---|---|
| LSRA | 16134 → 16135 | 129 → 64 | 44 | 2 |
| STA | 16135 → 16137 | 64 → 64 | A784 | 4 |
Select the LSRA row where PC advances. A zero-cycle boundary row can have the same mnemonic when execution resumes from a breakpoint. An IRQ can change the sample numbers and the distance between the rows. Use the PC, instruction bytes and register transition to identify them. The guest can already be back at BASIC while you inspect this file. Enter PRINT 27 to check.
Write a report someone can repeat
Give the other reader the source you actually ran, the VCC Plus build, guest processor, profile, RAM, video setting and any relevant media assignments. Name the breakpoint and whether it is before or after the write. For raw captures include the address space and inclusive range; for physical disassembly include the assumed CPU origin. Give one expected result, one observation and a way to distinguish the explanations.
For the beacon, a useful closing sentence is: “At line 80 the receiver contains the dot at (81,32), but the monitor still shows the house. One Space tap selects the receiver and the dot appears.” That last action lets a reader distinguish a display-page choice from a failed draw without changing the program.